Aphrodite
Honestly what was I thinking?
Aphrodite - Why is it named this?
Hey, uh.
Want to make money? I got stock strategies in my trench coat. This right here, this shit is called “Aphrodite” and I couldn’t tell you why. Guy who made it said “you’ll love it bro” and just buy it I swear you can make money with it.
Backtests? Yeah I got those. And some other shit. I don’t know you want this or not? I gotta run. My accountant just called and there’s a helicopter outside.

The Project (and its… “Vision”)

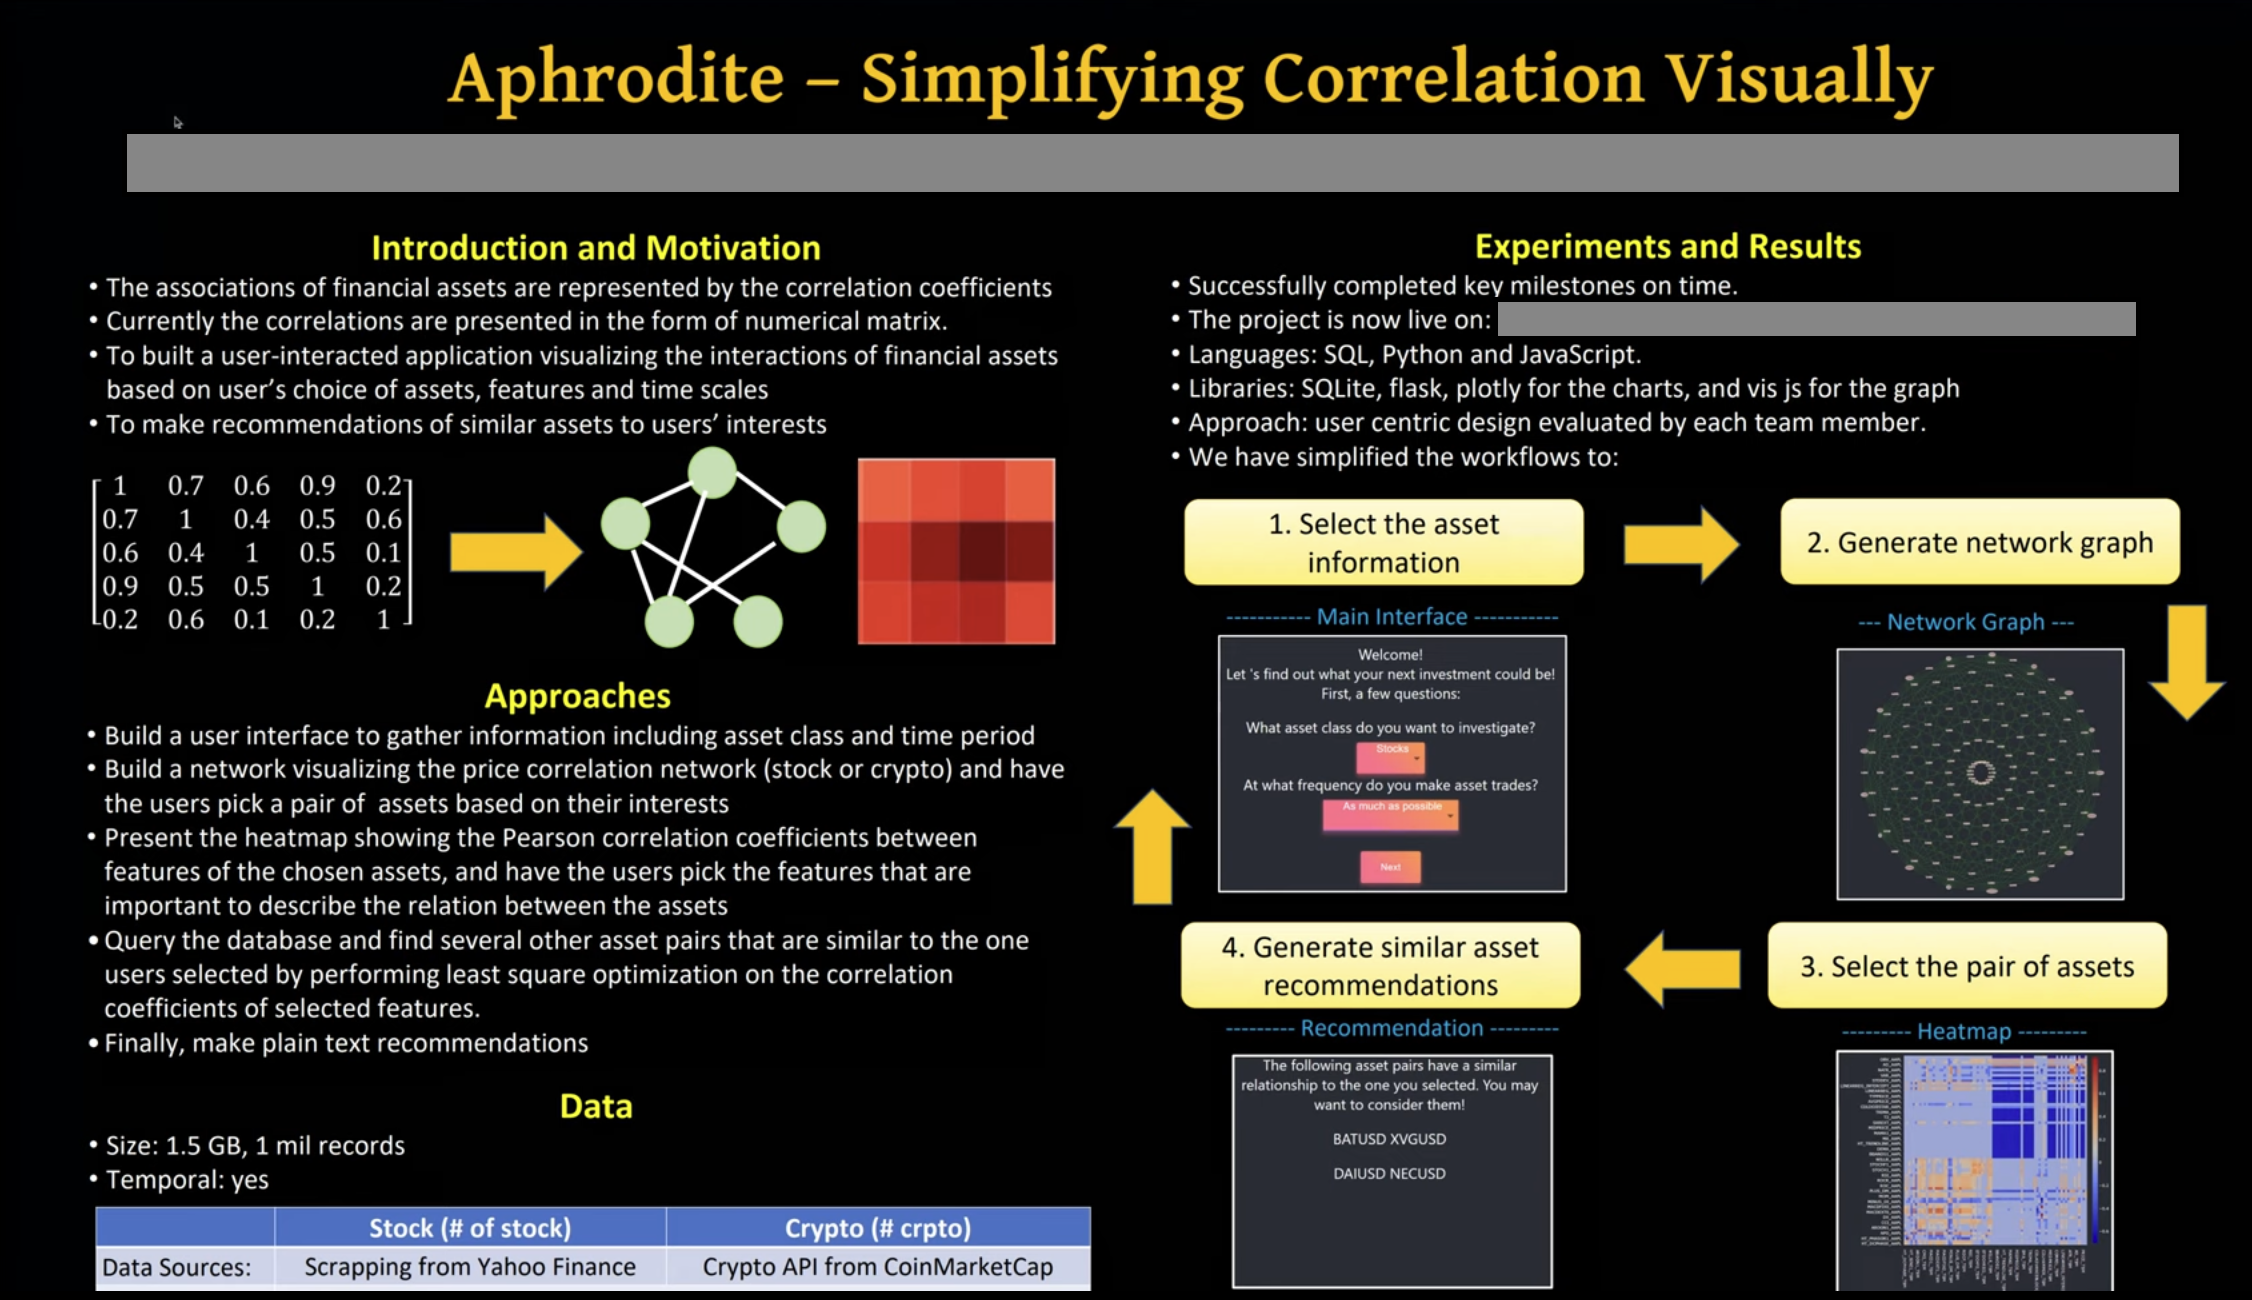
So, what was Aphrodite supposed to do, beyond looking like a hot mess?
- Risk Tolerance Assessment: A series of questions to gauge a user’s risk appetite. (A few radio buttons and sliders are totally enough to understand someone’s complex financial psychology right?)
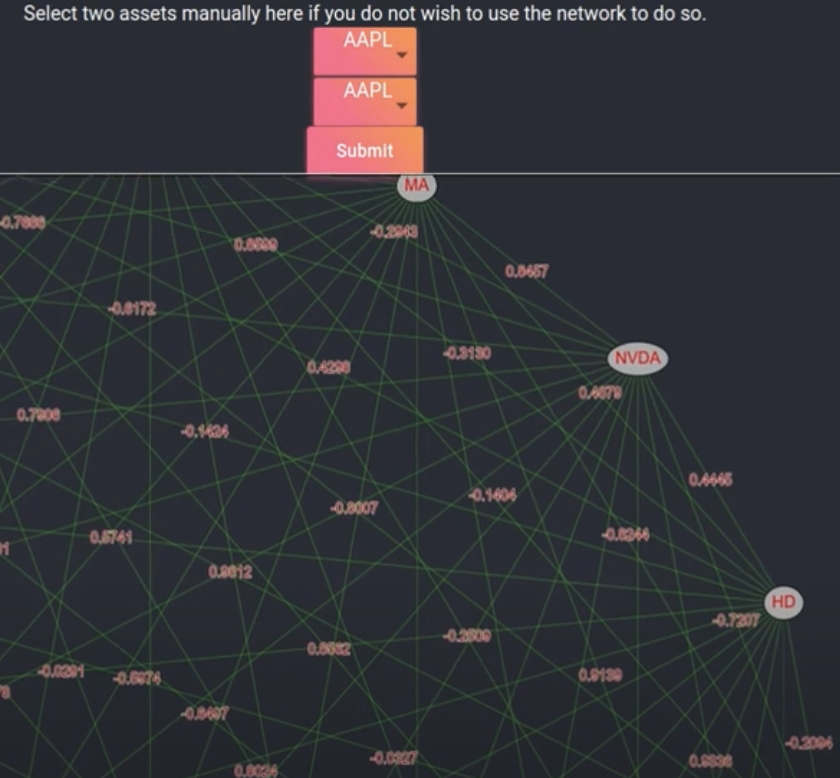
- Asset Network Visualization: Plotting a network graph of stocks and cryptocurrencies that a user might be interested in. (Why is that useful? Who knows! But it sure looks fancy, doesn’t it?)
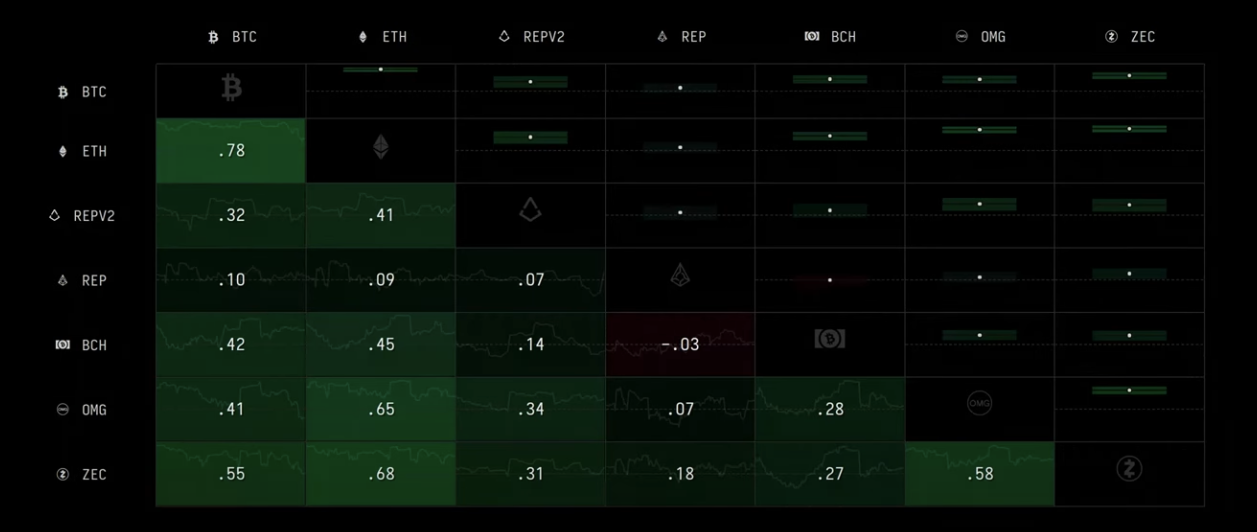
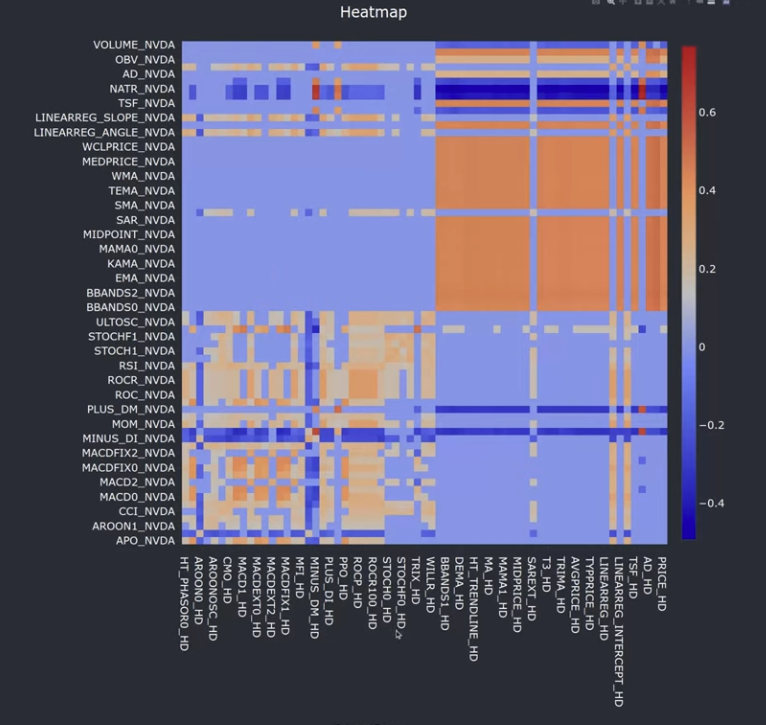
- Correlation Analysis: Allowing users to pick a pair of assets and visualize the correlation of various technical analysis features. (Explicitly I did this to take money from TA bros out there.)
- “What Moves Like What” Recommendations: The core “value proposition.” Based on a user’s preferred indicator (e.g., MACD) and an asset they liked, one could suggest other assets that exhibited similar movements. (“Leap blindly into the unknown, my friend, and never ask why!”)
I mean … I make fun of it but there were commercial alternatives kind of…


The Redemption: Architecture Design, Kinda
Despite the comedy of the visual design, this project was a fantastic opportunity to build something well from an architectural standpoint. Even for a grad school mock project, I prioritized an oddly robust and scalable (at least mentally scalable) system.
I’m actually quite proud of how this was built:
- Frontend-Backend Separation: One Flask app on the backend and a React frontend for easy and quick maintenance of separate parts.
- React for the Frontend: The UI was very hype beast orange and gray, but it was responsive and easy to update, even with a giant network graph visualization.
- SQLITE for Data Storage: A local SQLite database was used to store the asset correlation data and other relevant information. This made the application self-contained and easy to deploy.
- Any and all TA Features at once: I used TALib to compute all the TA features I could think of, so nothing really got missed. For ML purposes, why not do them all?
Epilogue (???)
This was called “Sick Coin” when we presented it instead of Aphrodite. What a contrast. Our branding switched from “weird cult mother crypto tool” to “saying bro every 3 seconds while you blaze the hype memes” in about a week.
Just be weird. It’s never too late. Don’t dream it. Be it.